Data Science Portfolio

Vehicle Insurance Data Analysis
Project Overview
An insurance company in India, primarily specializing in health insurance, is exploring the potential of expanding its presence in the vehicle insurance sector. This project involves analyzing a comprehensive dataset to uncover valuable insights, evaluate market viability, and guide strategic decision-making. The findings will help the company optimize its marketing investments and identify
opportunities for growth in the vehicle insurance segment.
Data source:
Health Insurance Cross Sell Prediction
Tools
Rstudio, Observable
Data Analysis
2 Main Questions
Results
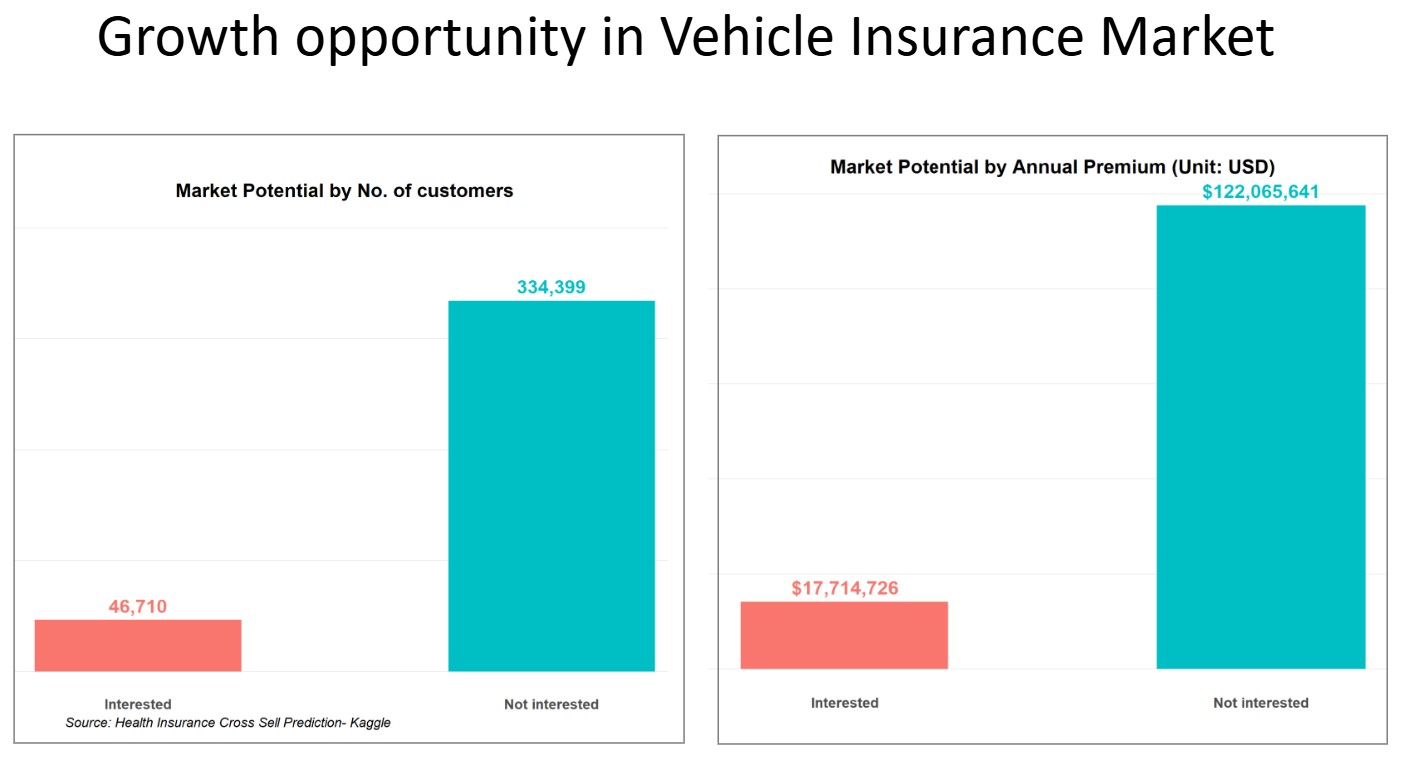
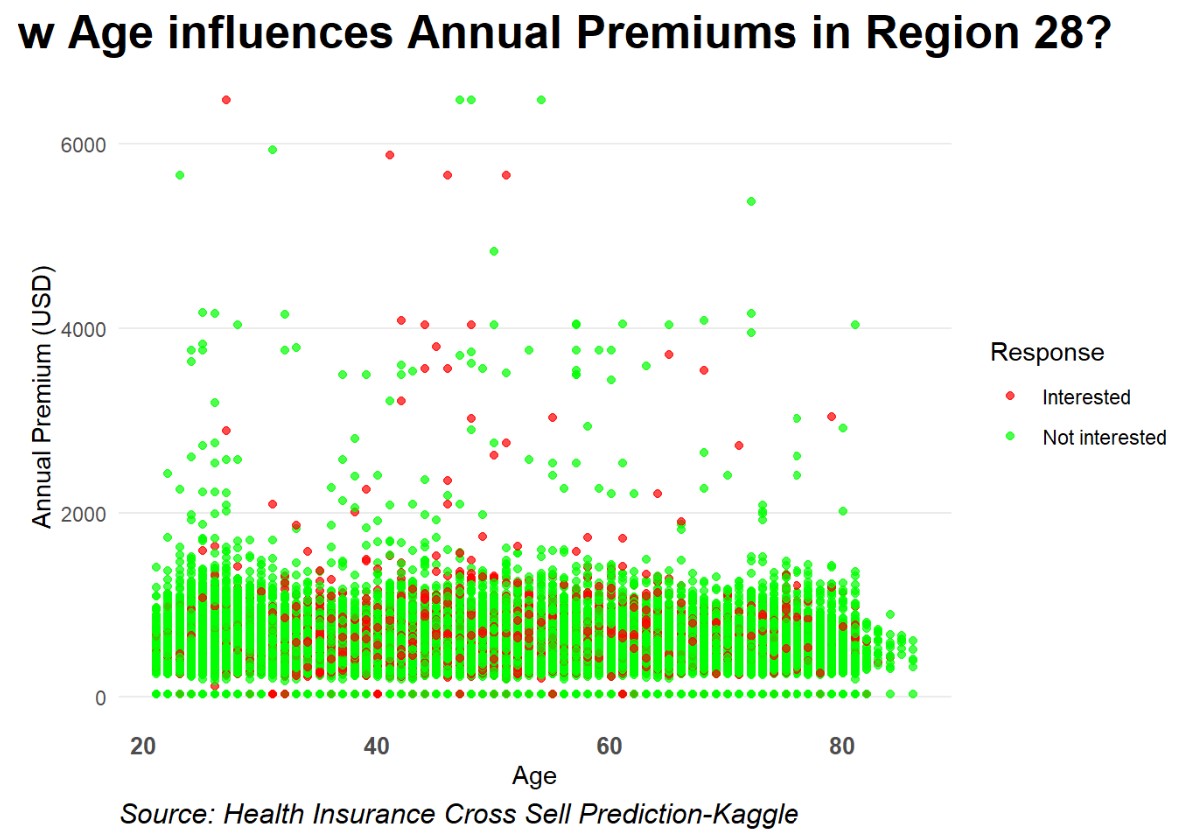
These charts highlighted several key insights:
- High Potential Business: Though the current market share is pretty modest, the company has huge room for growth by gaining the market share from their competitors.
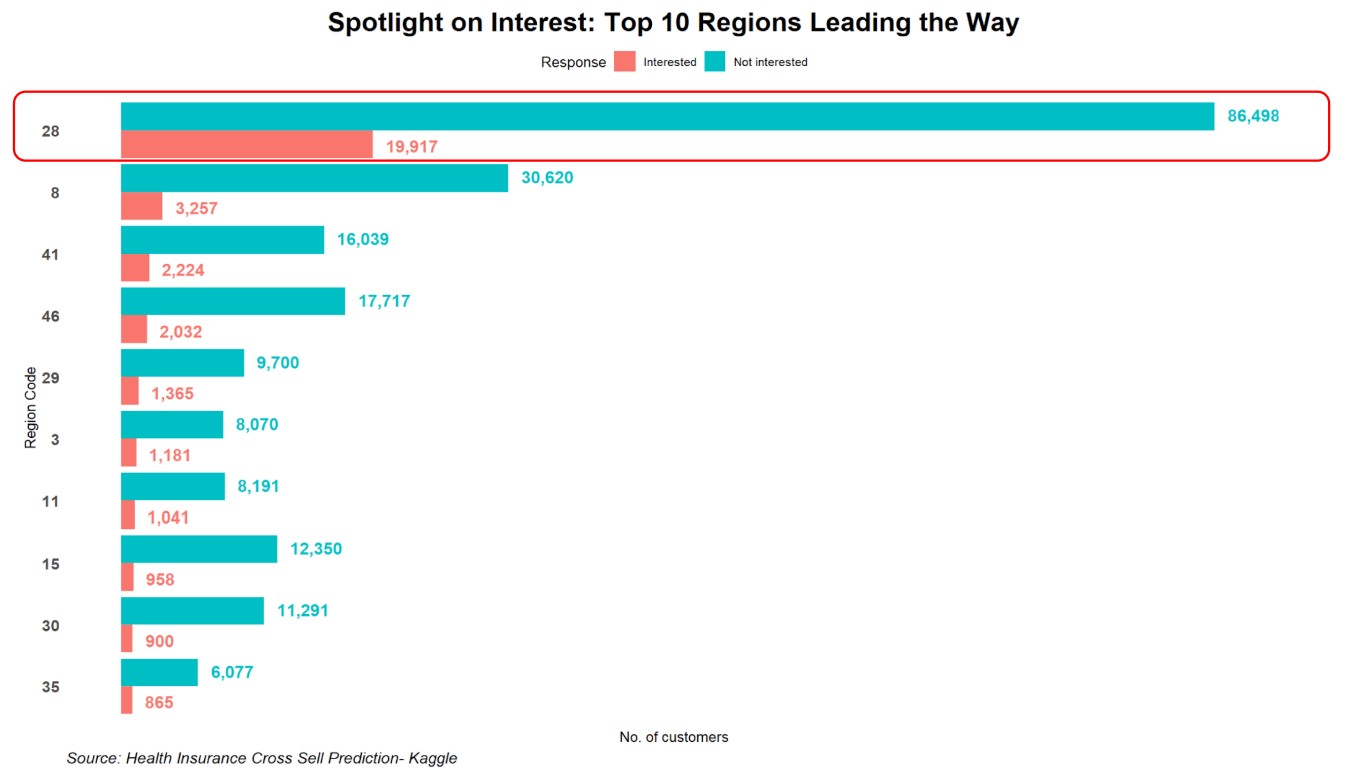
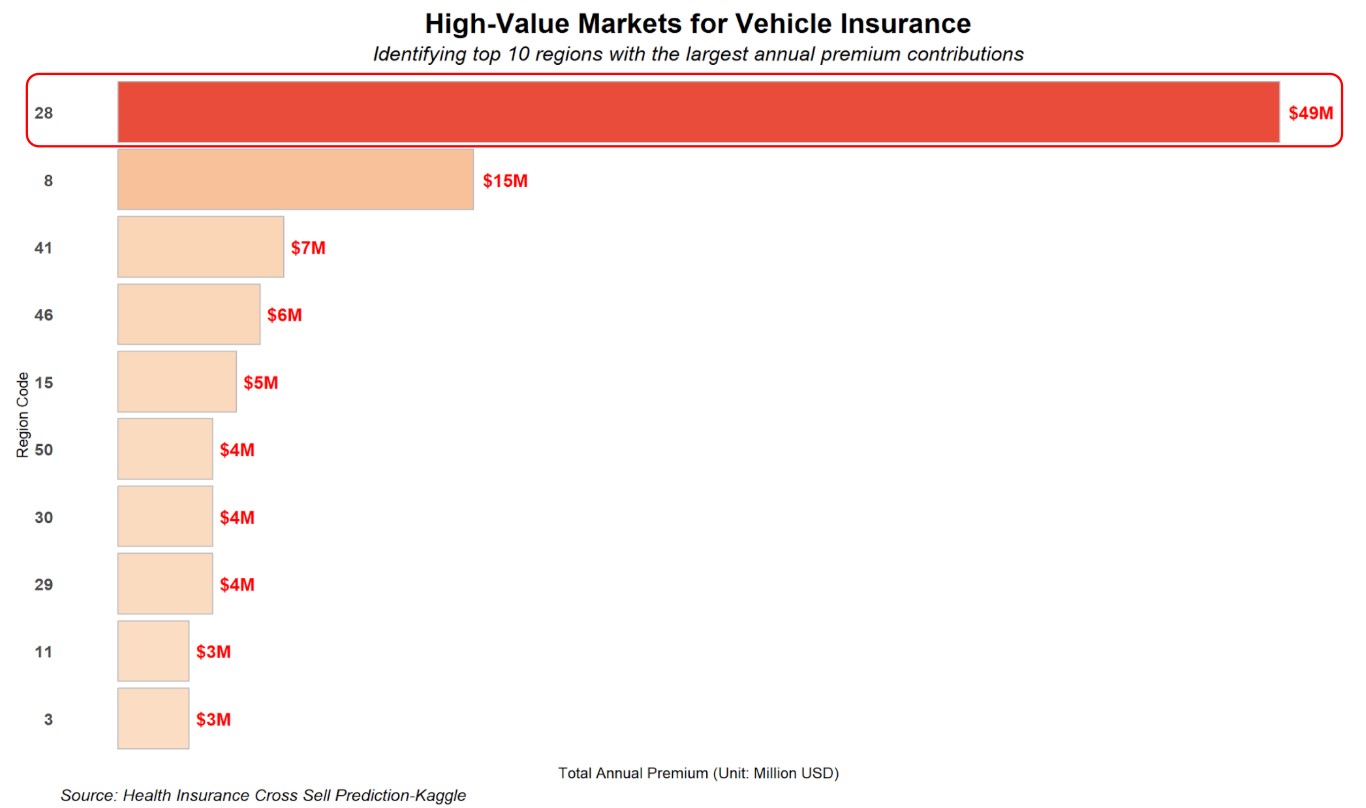
- Where do they should invest in? First, the Region 28 is the top-performing area with the largest interested customer base. Second, the significant no of uninterested customers in this region indicates that our competitors also focus on that region. Also, Region 28 stands out in annual premiums, way more higher than the other regions.
Recommendations:
- Focus on Region 28: Run targeted campaigns and marketing activities to strengthen our presence in this high-potential area.
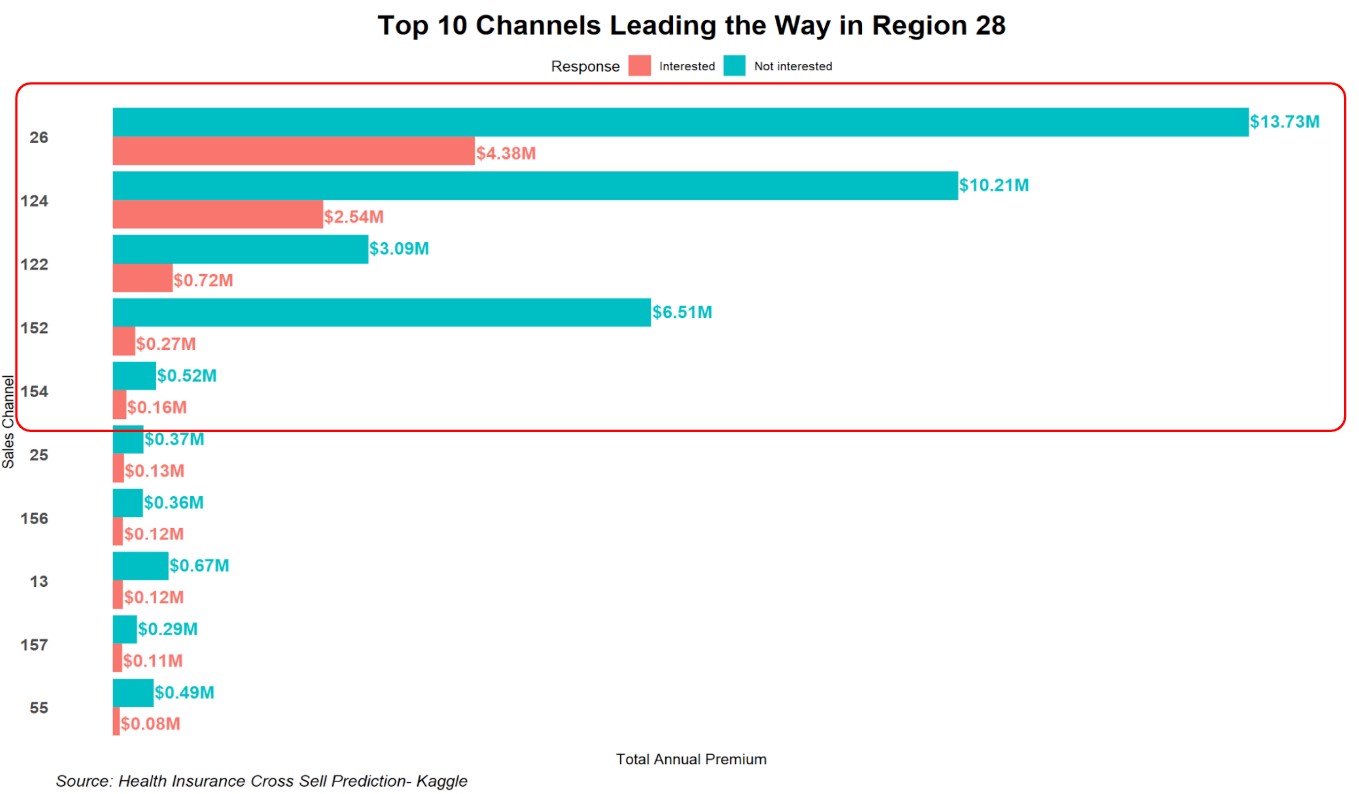
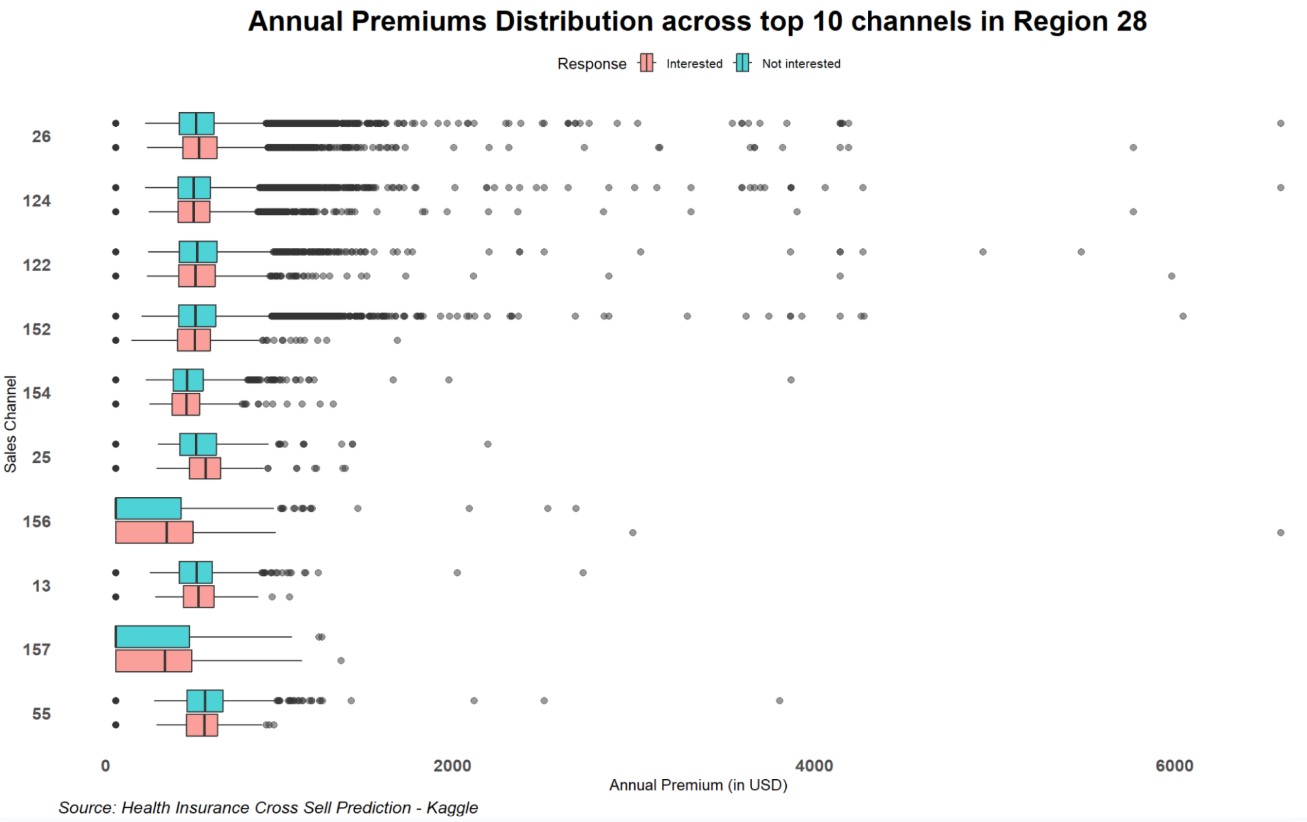
- Continue Investing in Key Channels: Maintain investments in the top 5 channels (26/124/122/152/154) to maximize performance.
- Enhance Customer Care: The sales team should prioritize nurturing relationships with interested customers to ensure their loyalty to our products.
- Engage Uninterested Customers: In Region 28, the sales team should focus on building relationships with uninterested customers to convert them into our clients from competitors.
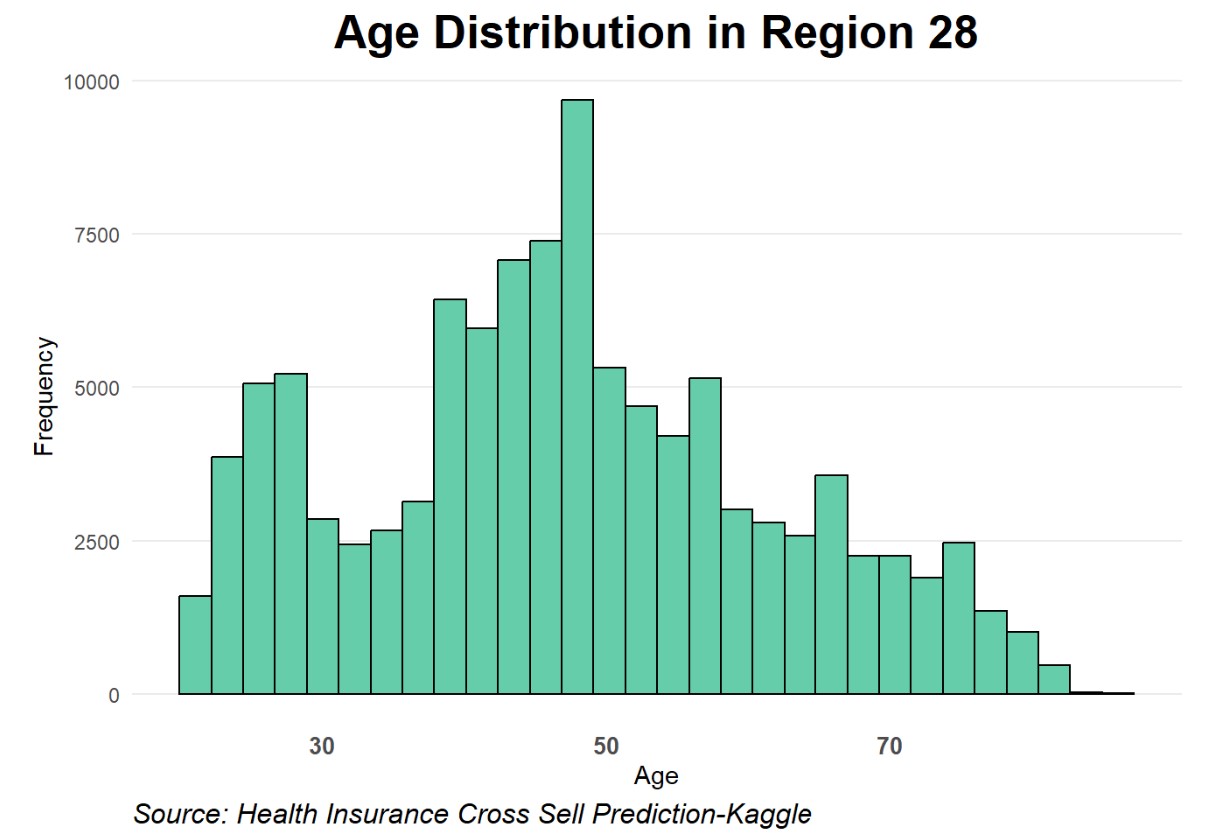
Currently, there are 86.5k uninterested customers in Region 28. As a realistic goal, we propose converting 100 of these customers (0.1% of the total) into our products, based on the capacity of our salesforce.
If you want to see the data analysis in Observable platform with JavaScript, click here.
Kickstarter Analysis
Project Overview
This project examines a dataset from Kickstarter, provided by Jonathan Leland through the Inter-university Consortium for Political and Social Research (ICPSR), to explore trends in crowdfunding campaigns from 2009 to 2020. We focused on identifying which types of projects attract the most and the least campaigns, observing how the number of campaigns has changed over time, and determining which categories are most likely to succeed or fail.
Kickstarter is a crowdfunding platform that has transformed the way creators bring their ideas to life. Since its launch in 2009, Kickstarter has enabled artists, musicians, filmmakers, designers, and other creators to fund projects through direct support from the public. This method bypasses traditional funding avenues, such as banks or venture capital, allowing both creators and backers to participate in the production of independent projects. The dataset encompasses over 500,000 crowdfunding campaigns spanning from 2009 to 2020, offering a broad perspective on the dynamics of crowdfunding activity over more than a decade. Each entry in the dataset includes details on the campaign’s category, launch and end dates, funding goal, amount pledged, and its success or failure.
Data source: KickstarterTools
Rstudio
Results
Conclusions:
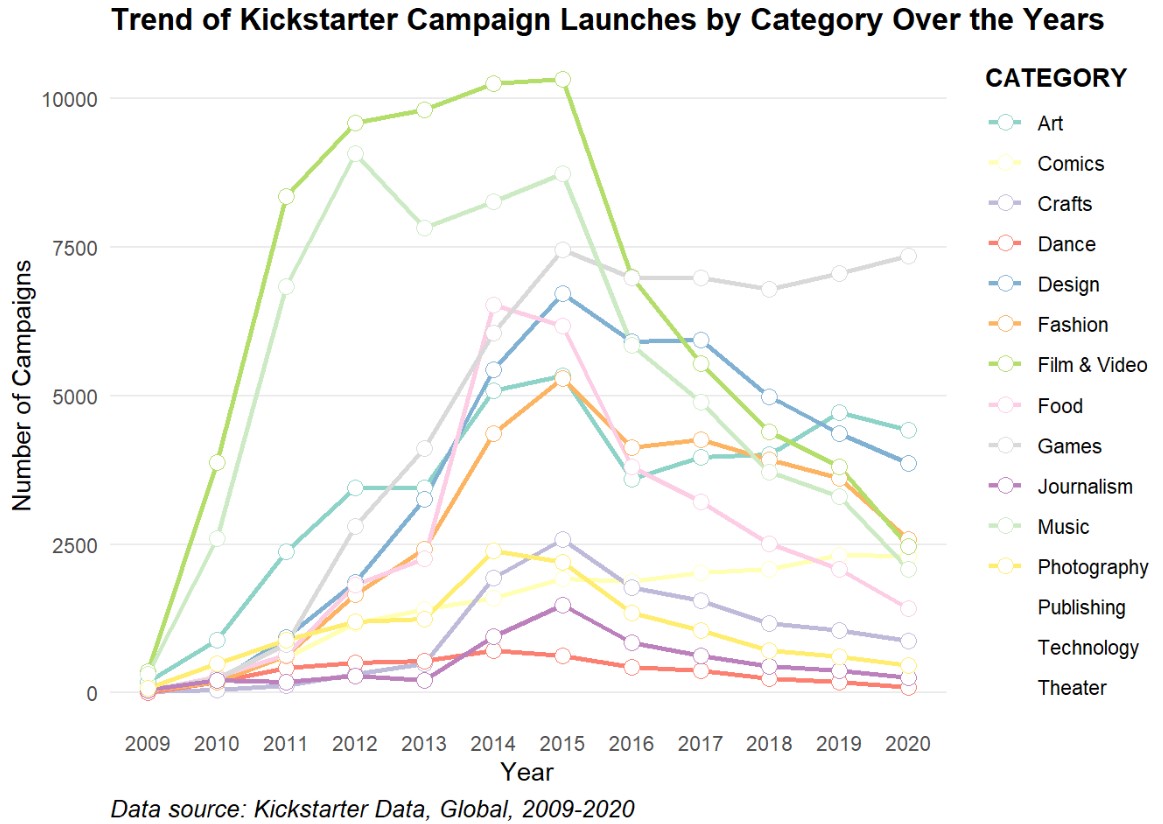
The analysis of the Kickstarter dataset has revealed key trends and success rates across various project categories from 2009 to 2020.
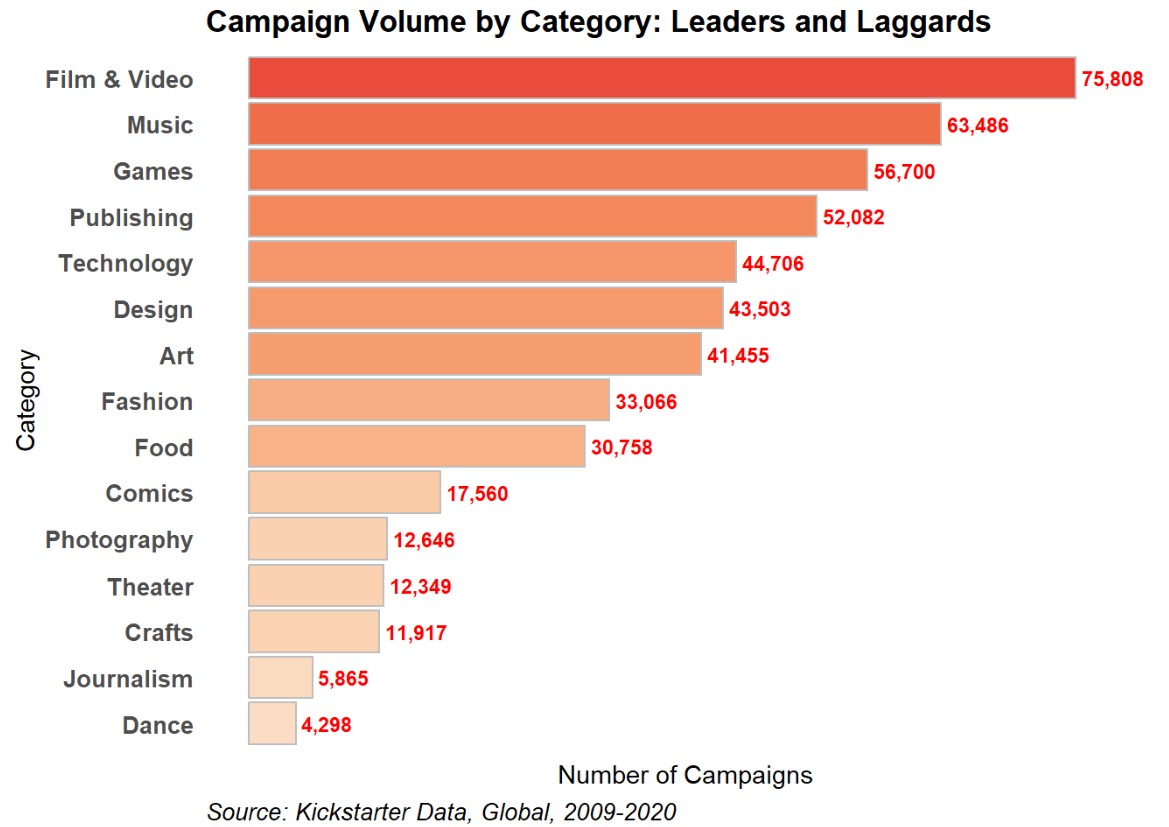
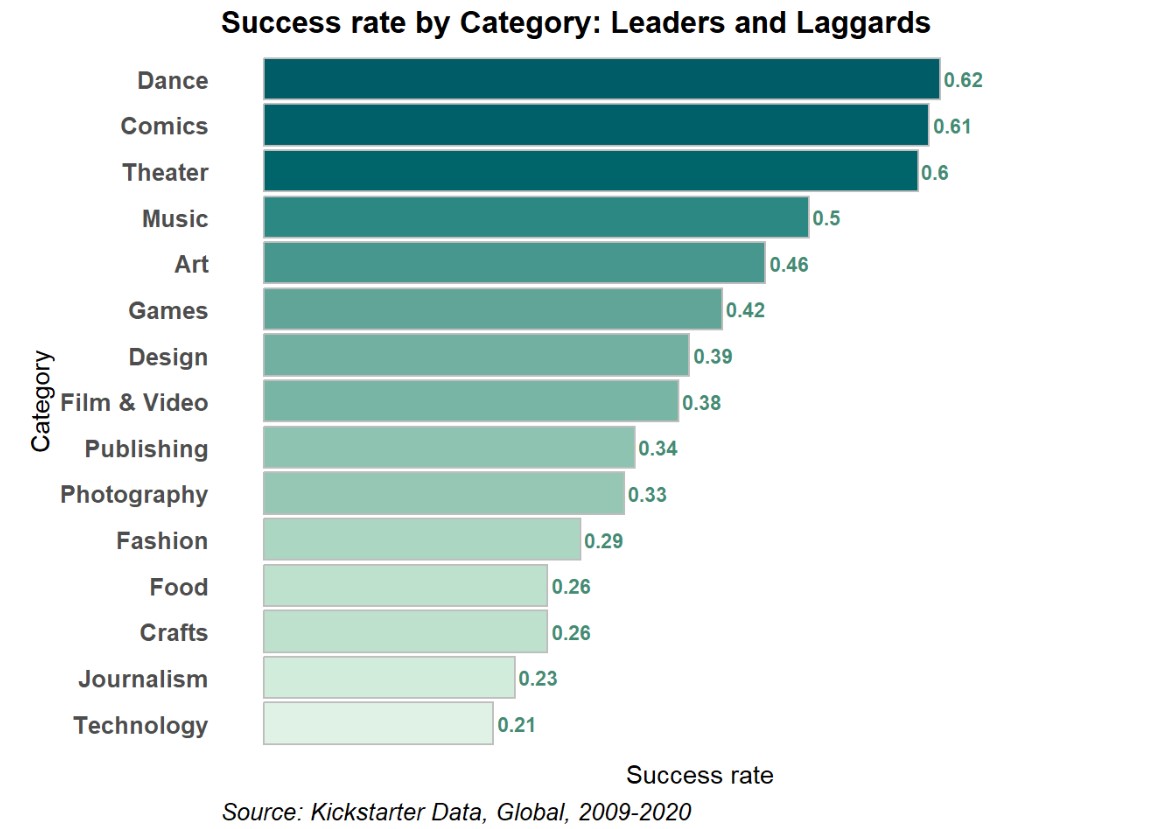
- Film & Video and Music categories dominated in campaign volume, while categories like Dance and Comics were less frequent but showed surprisingly high success rates.
- The overall trend observed was an increase in campaign launches peaking in 2015, followed by a decline, reflecting shifts in consumer preferences.
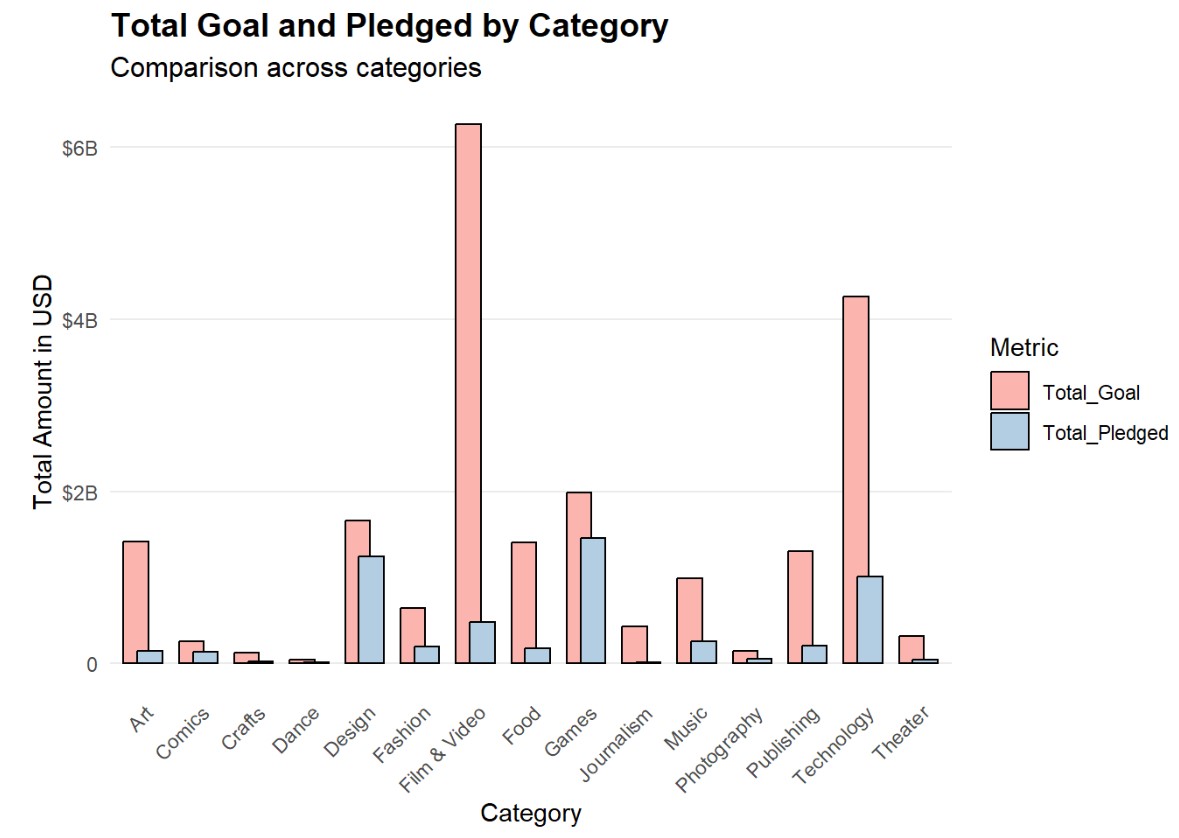
- In addition, significant differences in success rates across categories were identified, like Dance, Comics and Theater being more successful. In contrast, Technology projects, despite their popularity, had higher failure rates, possibly due to ambitious funding goals.
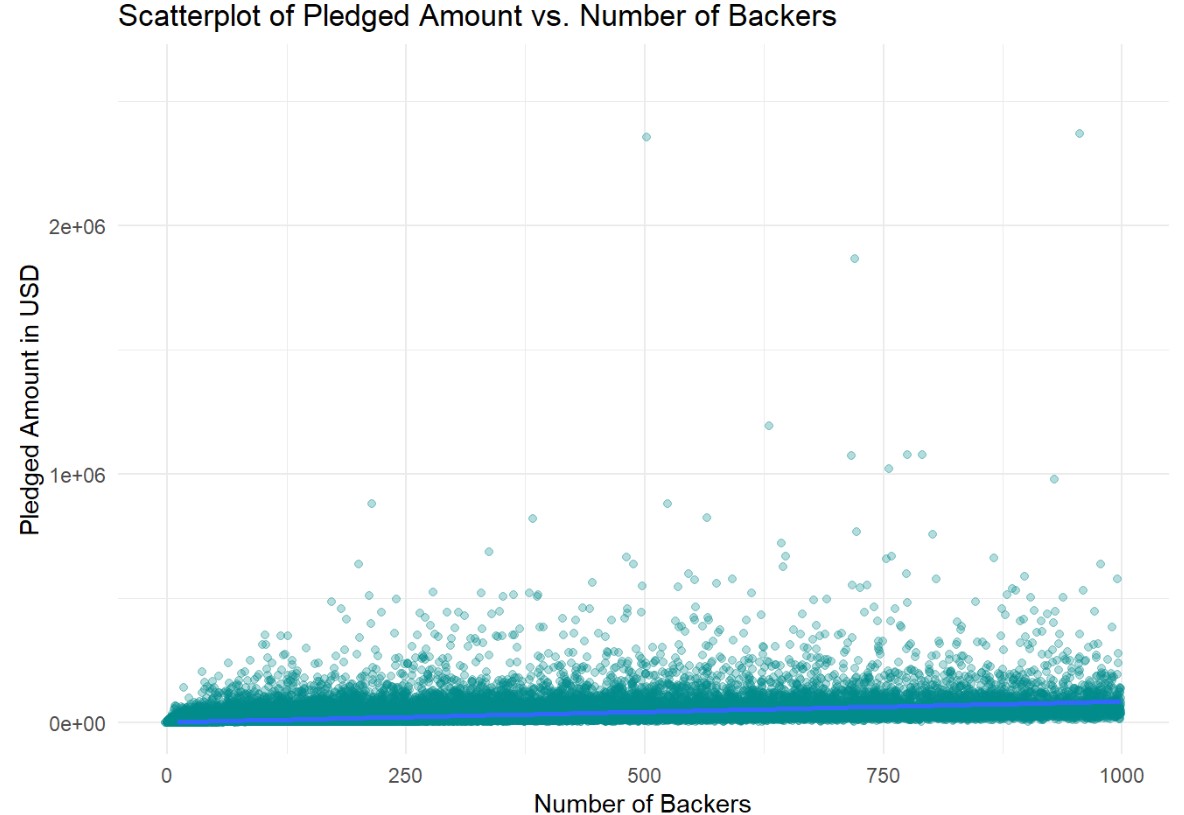
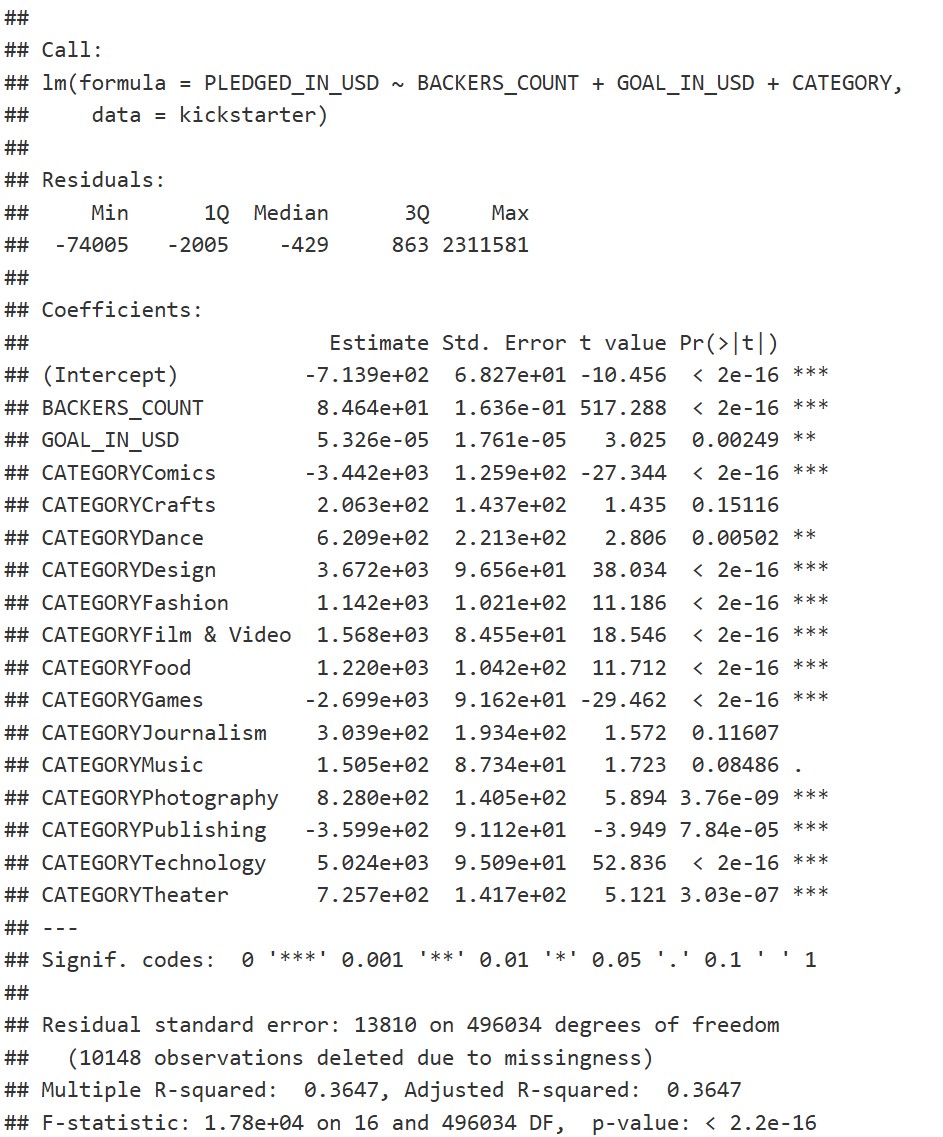
- However, the regression model revealed that while category, number of backers, and funding goals are predictive of the amount pledged, they explain only about 36.47% of the variability, which means unmodeled factors could further influence outcomes. This analysis provides a foundational understanding for potential creators and backers but also suggests the need for deeper investigation into other influential factors not captured in this dataset. Future research could benefit from incorporating qualitative data, like project descriptions and creator backgrounds, to enhance the analysis outcomes.
Neftlix Analysis
Project Overview
This project analyzes Netflix's movie and TV show catalog, focusing on its global distribution, audience preferences, and growth trends. The findings provide valuable insights for understanding Netflix's content strategy and audience engagement patterns.
Tools
Tableau
Results
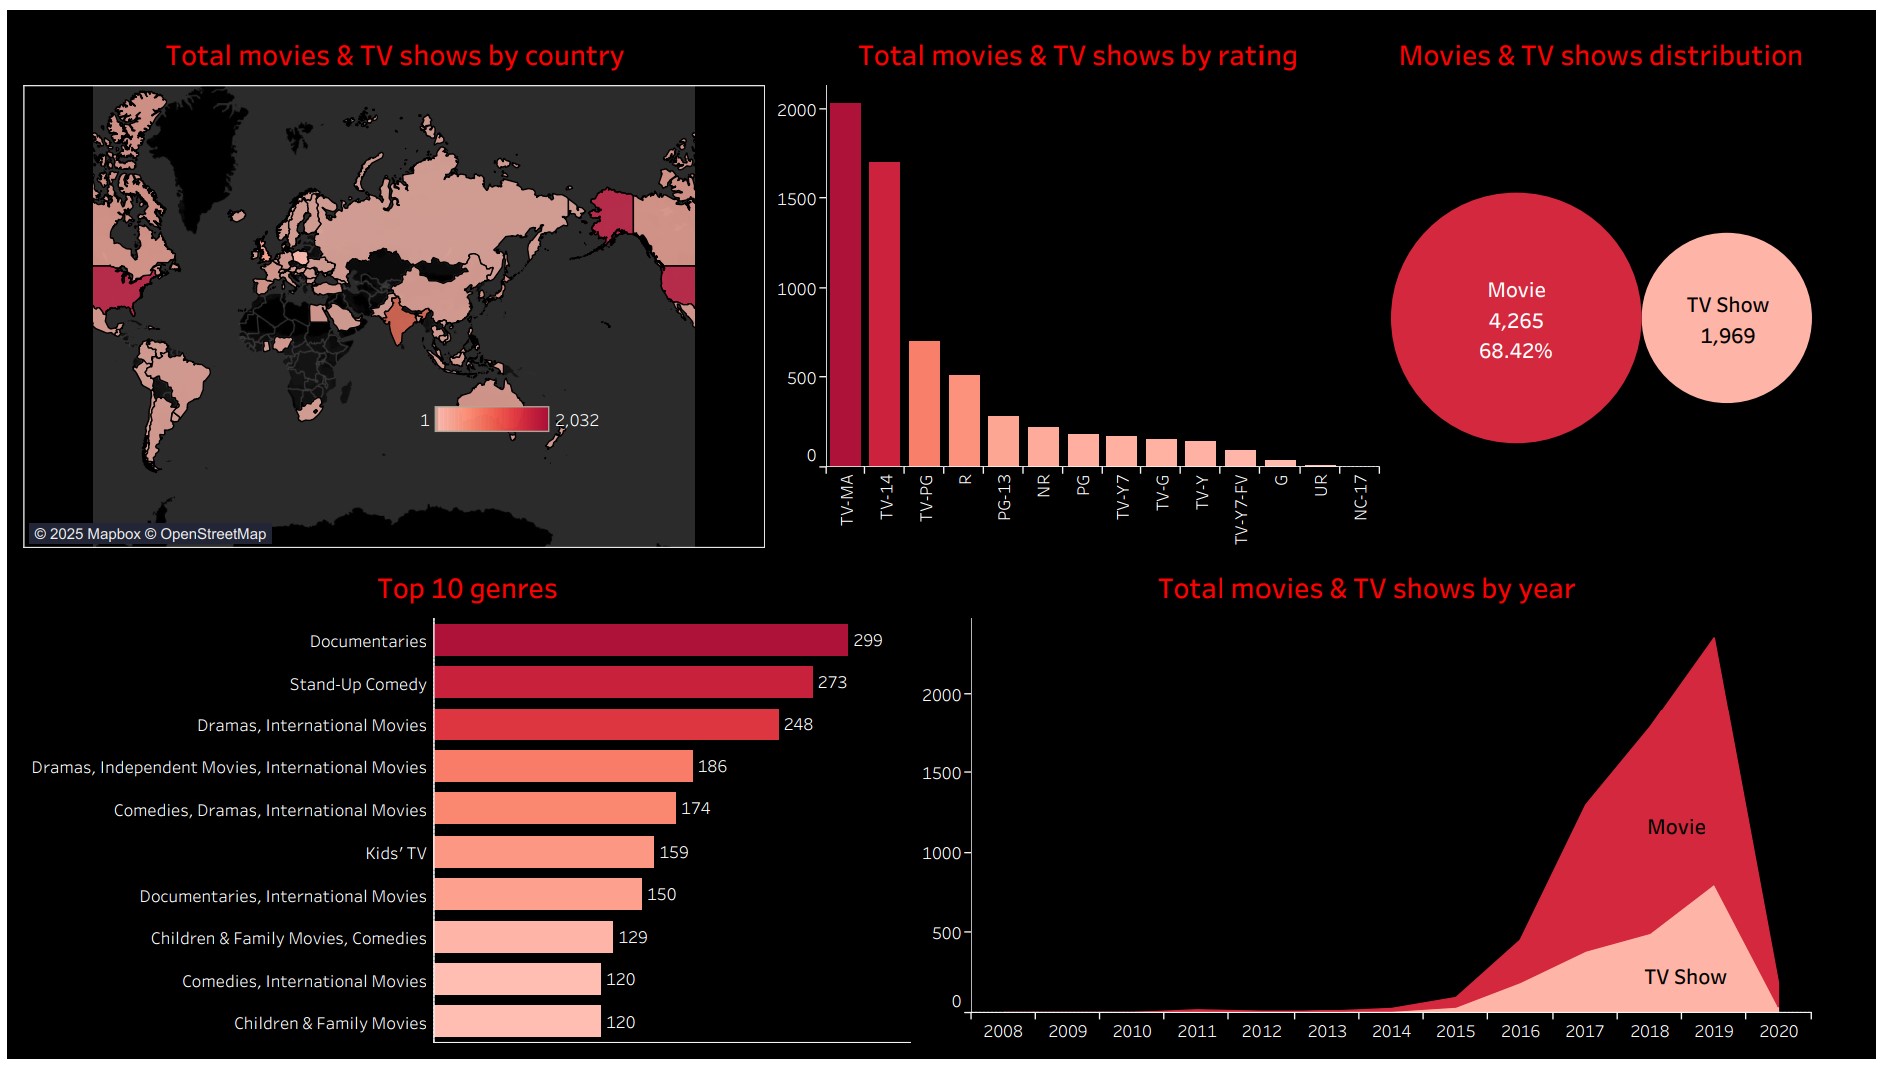
To see the dashboard, visit this link: Neftlix Dashboard
Bus Transportation Analysis in Line City
Project Overview
This project focuses on understanding the performance and utilization of the bus transportation system in Line City during December 2023. Key insights include rider demographics, route performance, and utilization patterns, enabling data-driven decisions for system optimization.
Tools
SQL, PowerBI
Results
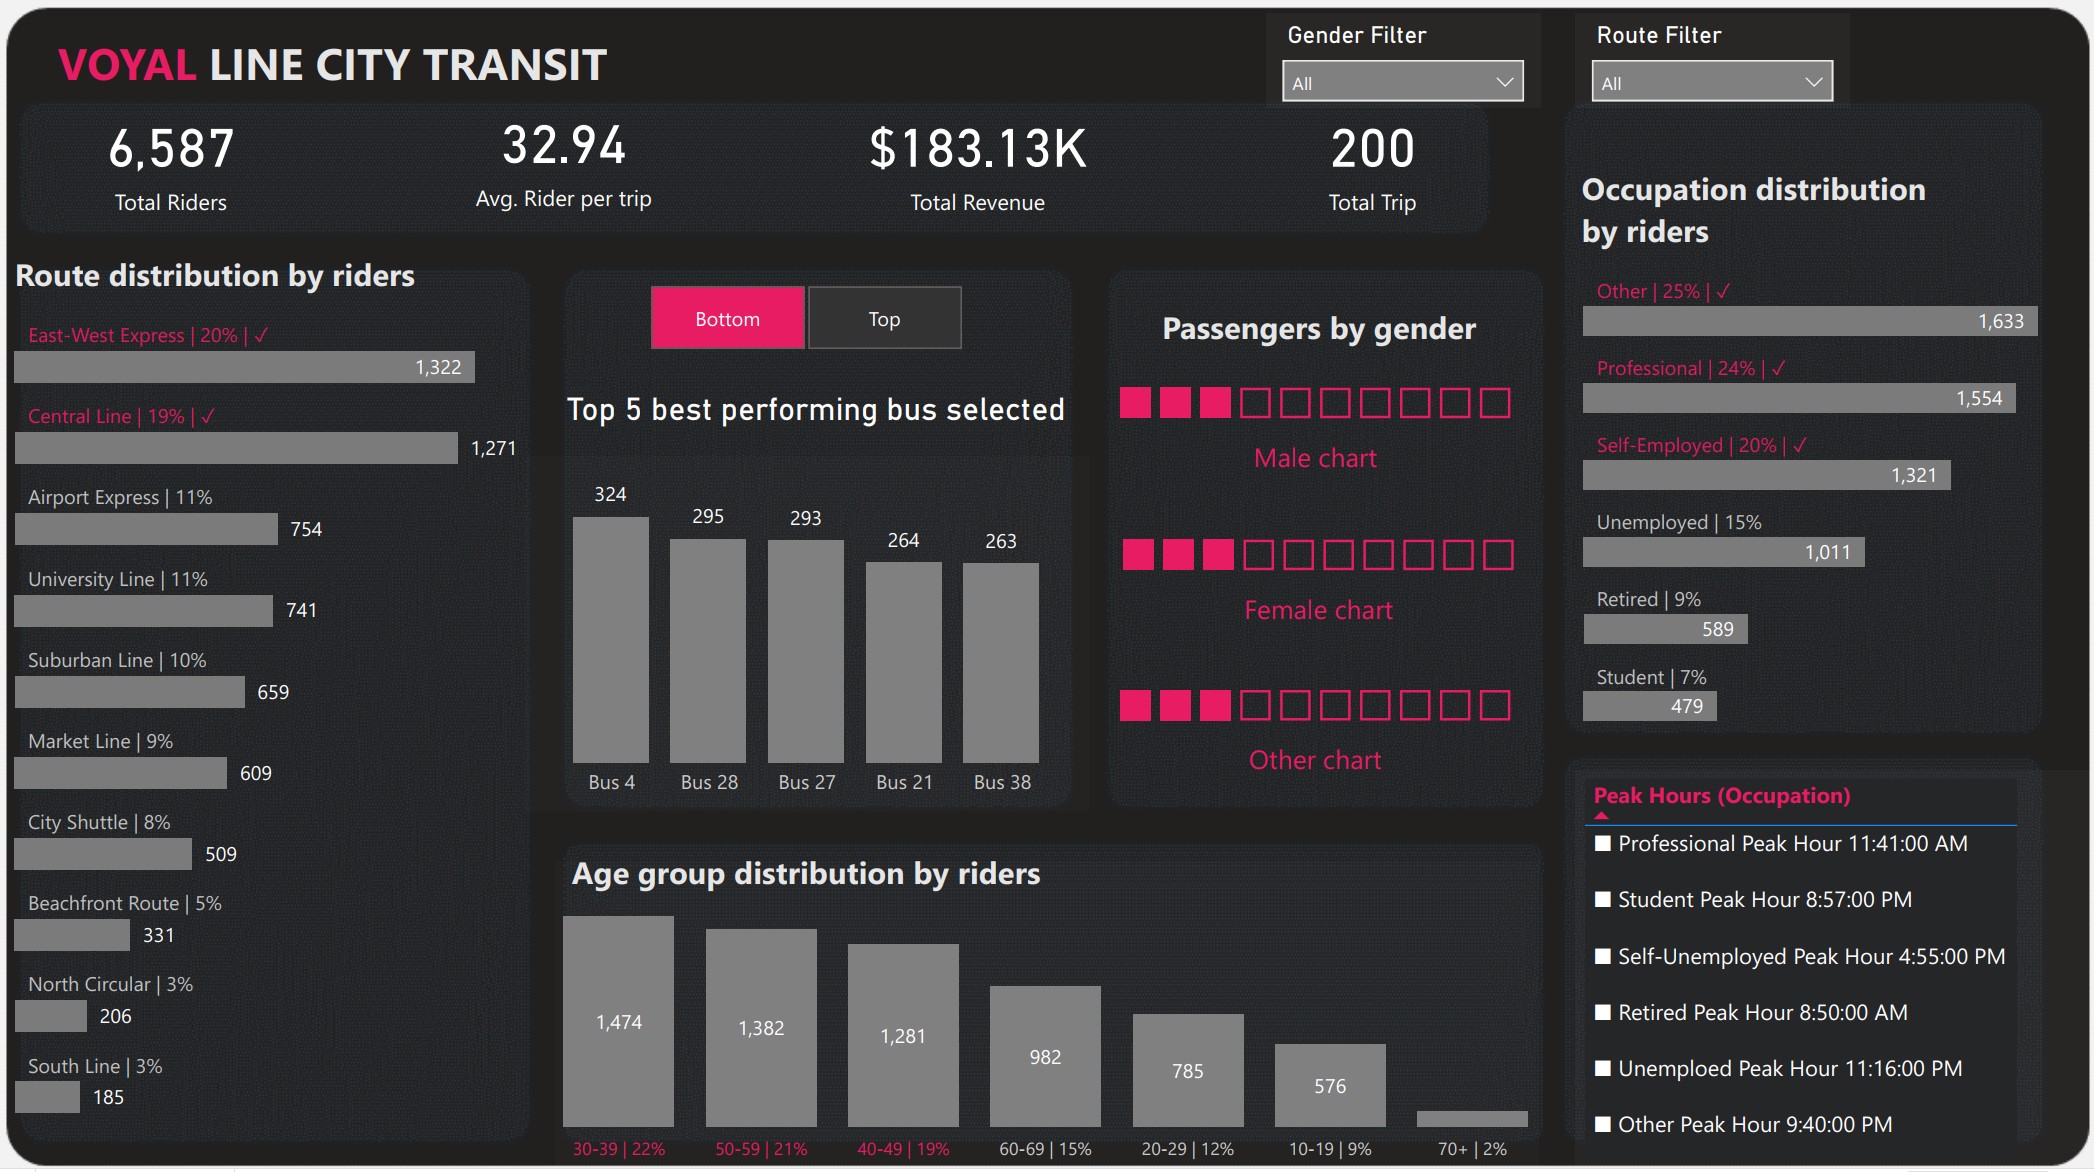
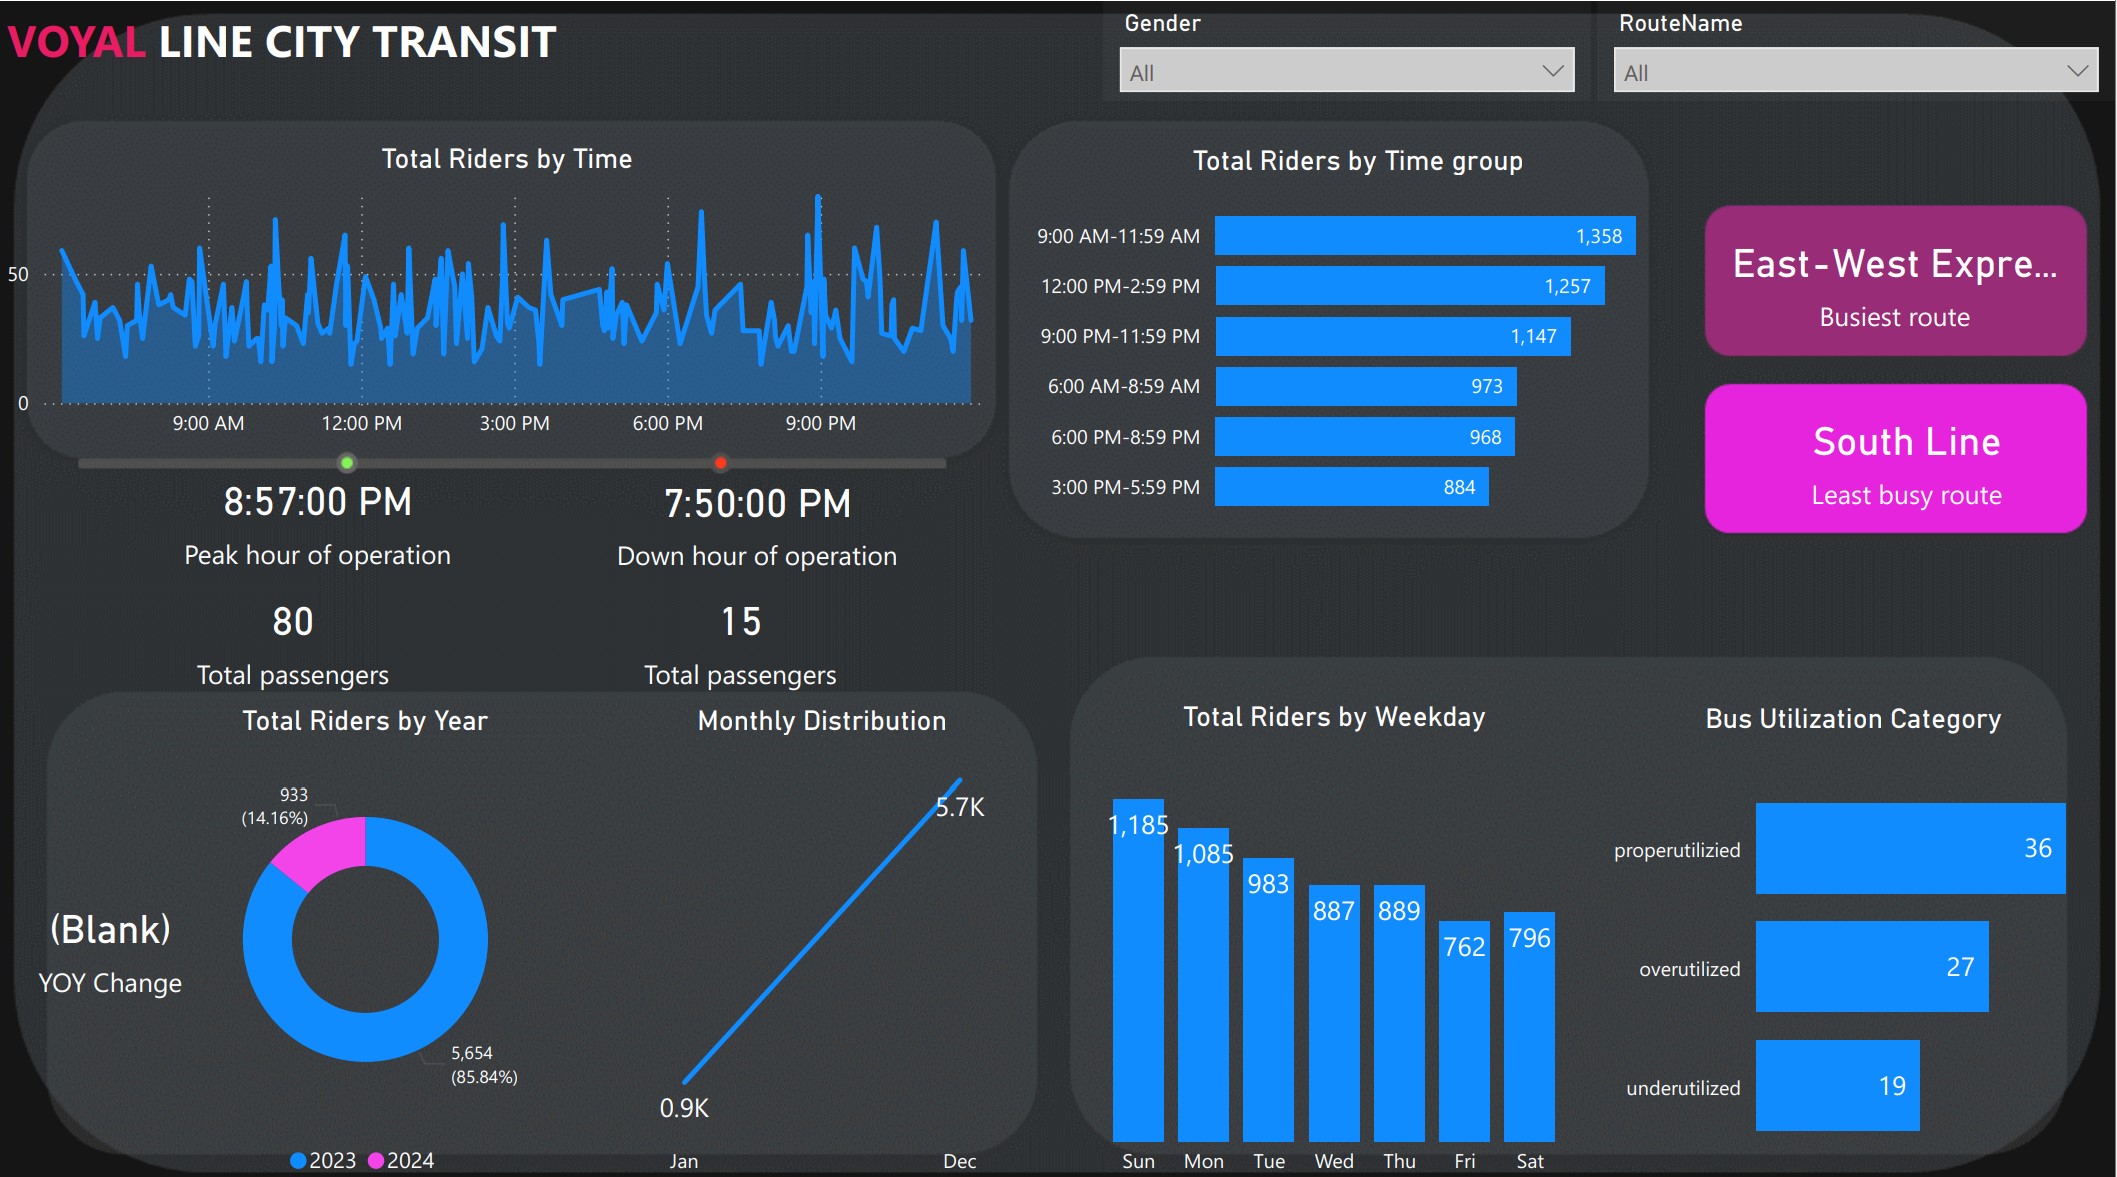
To see the dashboard, visit this link: PowerBI Dashboard